
Shopify offers a built-in way to track how many customers are adding items to their carts.
Knowing what your customers add to their carts is a great way to understand what’s working and what’s not on your Shopify store. With this data, you can spot popular products, improve product placement, and even test bundling strategies. Understanding cart behavior is a crucial component of any comprehensive Shopify CRO audit checklist for optimizing your store’s performance.
Here’s a simple guide to help you track “add to cart” activity in Shopify.
Where to find the “Add to Cart” data in Shopify
To view cart addition sessions:
- Log in to your Shopify admin panel
- Click on ‘Analytics’
- Click on ‘Reports’
- Click the ‘Category’ filter
- Select ‘Behavior’
- Open either:
- “Conversion rate breakdown” report (shows funnel view)
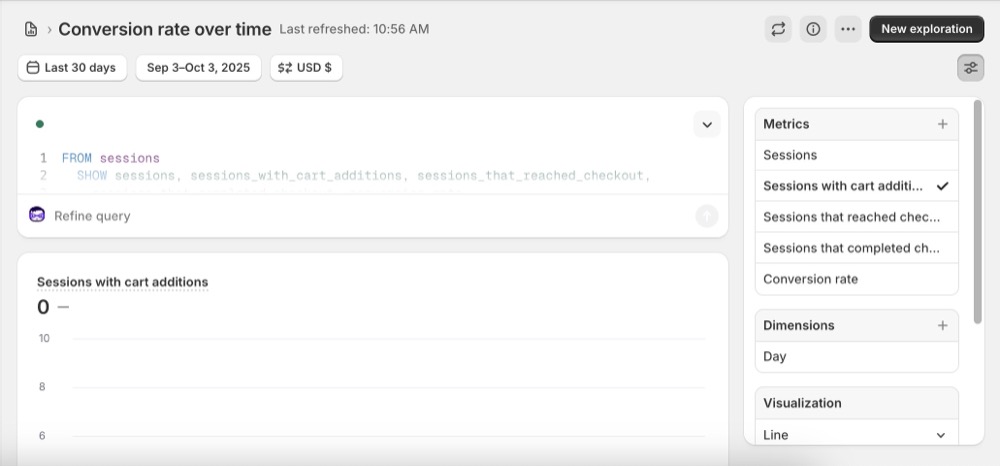
- “Conversion rate over time” report (shows trends over time)
Both reports show “Sessions with cart additions” – which tracks visits where products were added to cart.
Depending on your Grow plan, you might see different report names or limited data. Full behavioural reports are typically available on Shopify, Advanced, or Plus plans.
What the “Sessions with Cart Additions” shows
This metric helps you track:
- How many sessions resulted in a customer adding something to their cart
- Trends over time (daily, weekly, monthly)
- Whether your marketing and product pages are encouraging people to take action
- Your add-to-cart conversion rate (cart additions ÷ total sessions)
It’s a helpful starting point for improving your conversion rate and reducing cart abandonment. For better visibility, organize your analytics dashboard with custom sections to group cart metrics separately from sales data. When combined with strategic product displays like collection carousels, you can create a more engaging shopping experience that encourages customers to add multiple items to their carts.
Understanding the Conversion Funnel
In the Conversion Rate Breakdown report, you’ll see a funnel with:
- All sessions – Total visits to your store
- Sessions with cart additions – Visits where products were added to cart
- Sessions that reached checkout – Visits where checkout was initiated
- Sessions that completed checkout – Visits resulting in purchases
The conversion rate for each step is calculated as:
- Number of sessions for that step ÷ Total sessions × 100
Example: If you had 1,000 sessions and 200 sessions with cart additions, your add-to-cart rate is 20%.
Using the Conversion Rate Over Time Report
This report displays multiple metrics including:
- Total sessions
- Sessions with cart additions
- Sessions that reached checkout
- Sessions that completed checkout
You can:
- Group data by day, week, or month to identify patterns
- Compare data from different date ranges to track improvement
- Monitor trends to see if changes to your store increase cart additions
Where to see which items are added together
Note: Shopify offers ShopifyQL Notebooks (launched in 2023, available as of November 2025) where Shopify Plus merchants can run queries to analyze add-to-cart behavior much more deeply without third-party apps.
ShopifyQL Notebooks allows you to:
- Write custom queries to analyze cart behavior
- Get product-level add-to-cart data
- Combine data from multiple business domains
- Create visualizations and data stories
- Access raw commerce data with an intuitive query language
This tool is exclusively available to Shopify Plus merchants at no additional cost and can be downloaded from the Shopify App Store.
What if you don’t see any data?
Don’t panic if your reports show low or no activity. This might happen if:
- Your store is new
- You have low traffic
- You haven’t had enough recent sessions to populate the report
Tip: Run a promotion, email campaign, or ad to drive traffic, then check the reports again in a few days.
FAQ
Q: Can I track which specific products are added to the cart the most?
The standard “Sessions with cart additions” metric shows total sessions with cart activity, but doesn’t break down by individual product. For product-level cart data, you need:
ShopifyQL Notebooks (Plus only): Custom queries for product-level cart data
Google Analytics 4 (GA4): Track “add_to_cart” events with product details
Third-party Shopify apps: Cart Insights, Cart Unwrapped
Q: Why does my report say there’s not enough data or show zero?
It usually means you haven’t had enough recent traffic or add-to-cart actions. Try increasing traffic and check again later. If you’re consistently having low traffic, it might be worth exploring our technical SEO services to improve your store’s visibility in search results.
Q: Do I need an app to track this?
Not always. Shopify’s built-in analytics (for mid-to-higher plans) include this feature. But if you want more control, apps or GA4 can help.
- Google Analytics 4 (GA4): Track “add_to_cart” events manually with the right tracking setup.
- Hotjar or Microsoft Clarity: See how users interact with your product pages and cart.
- Shopify apps: Some analytics or CRO apps show add-to-cart behaviour with more detail.