Google Analytics has become the defacto standard for web analytics.. You will have data to catch up with what’s going on your website. One of the issues is sometimes the amount of data available is overwhelming and is often hidden deep in confusing reports. Even a professional marketer can end up lost.
What if there was a tool that would help you pick out the parts of the data you wanted? And visualise them for free.
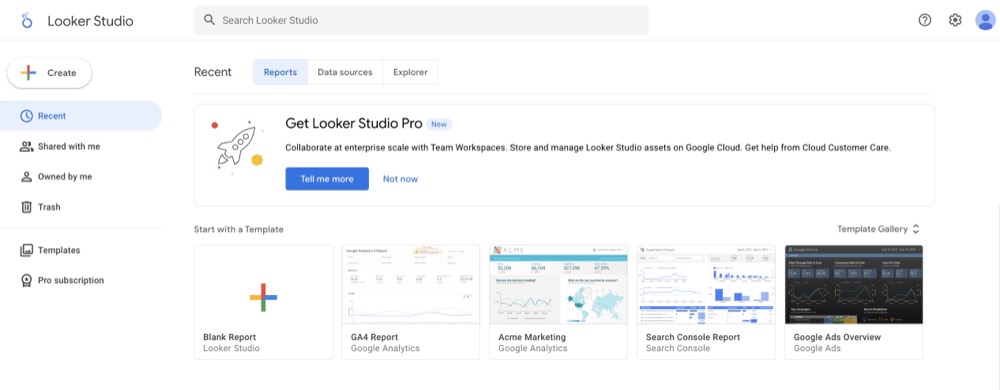
Well, luckily such a magic tool exists. Introducing Looker studio – a simple yet powerful tool to visualise your data and help you make smart decisions. In this article, you’ll learn step-by-step how to make Google Analytics report in Looker studio for things like SEO, Google Ads, or an online store.

What is Looker Studio?
Before getting started, let’s improve our understanding of what looker studio is. Looker Studio, formerly Google Data Studio, connects to a variety of data sources including Google Analytics, and provides you with a platform to design your own drag and drop reports and dashboards to visualise that data.
How to make Google Analytics report in Looker studio
Connect GA to Looker Studio
First you’ll need to connect Google Analytics as a data source to your Looker Studio account.
- Go to Looker Studio and sign in with your Google account.
- Click the “Create -> Data source”
- A dashboard of sources will show up.
- Choose “Google Analytics” as your data source
- Authorise your GA account to Looker studio then select the connect button. You may need administrator access to complete this.
- A dashboard of data from GA will show up. Then click create report to start making a GA report.
Customise your report
You can create different types of reports depending on your goal. For example, if you want to understand how social media platforms are driving traffic to your website, Looker Studio can help you
It has many templates for you to choose from. You can pick one that you are confident to customise or you’ll be presented with a blank canvas for your new report.
Select one option and name your report something descriptive like “Social Media Traffic Analysis”.
To answer the question about social media traffic and provide a platform breakdown, include the following data in your report:
- Total number of visitors from all social media platforms combined:
- Metric: “Users” or “Total users”
- List of all social media platforms that drove traffic to your site:
- Dimension: “Source” or “Social Network”
- Number of visitors from each individual social media platform:
- Dimension: “Source” or “Social Network”
- Metric: “Users” or “Total users”
- Percentage of total social media traffic for each platform:
- Dimension: “Source” or “Social Network”
- Metric: “Users” or “Total users”
- (Looker Studio can calculate percentages automatically)
- Date range for the data being displayed:
- Dimension: “Date”
Additional metrics you might find useful include:
- “Sessions” to show total visits (including repeat visitors)
- “New Users” to show first-time visitors
- “Pages / Session” to show engagement level
- “Avg. Session Duration” to show time spent on site
By including these data points in your report, you’ll have a clear picture of your social media traffic sources and their relative performance.
Remember to save your report and set up regular data refreshes to keep your insights up-to-date.
Share report with your team
If you are working with your team or a client, you can share the report via email, link, or embed on a website.
FAQ
1. How can I create a custom calculated metric in Looker Studio using GA data?
To create a custom calculated metric in Looker Studio:
- Open your report and select the chart or table where you want to add the metric.
- In the Data panel, click on “Add a field.”
- Use the formula editor to create your custom metric. For example, to calculate the conversion rate, you might use: Sessions / Goal Completions.
- Name your calculated metric and click “Apply.”
- Ensure that the new metric is correctly formatted by adjusting its data type if necessary.
2. How can I blend data from multiple GA views in Looker Studio?
To blend data from multiple GA views:
- Go to your Looker Studio report and click on the “Resource” menu, then select “Manage blended data.”
- Click “Add a data view” and choose the first GA view.
- Click “Join another table” and select the second GA view.
- Configure the join keys and select the metrics and dimensions from each data source you want to include.
- Click “Save” and use this blended data source in your visualisations.
3. How can I create a time series comparison between different periods in Looker Studio using GA data?
- Add a time series chart to your report.
- In the chart’s data panel, ensure you have a date dimension.
- Add a comparison date range by clicking on “Date range” and then “Comparison date range.”
- Select the comparison period (e.g., Previous period, Previous year) to compare metrics over different times.
- Customize the appearance and labels of the time series chart to clearly indicate the comparison.
4. How can I filter GA data in Looker Studio to show specific segments?
- Use the “Add a filter” option in the Data panel for your widget.
- Define your filter conditions. For example, to show data for mobile users only, create a filter where Device Category equals mobile.
- Apply the filter to your chart or table.
- You can also use filter controls in your report to allow viewers to dynamically segment the data.
Conclusion
Using Looker Studio, you can turn complicated Google Analytics data into easy-to-understand visuals. This helps you make smart decisions quickly, share important info with your team, and reach your marketing goals more easily.