
Speed is crucial in retaining users and also can affect how well your site ranks in search engines. If visitors have to wait too long for your site to load, it means you are not providing a good user experience. To prevent your website becoming slow, website performance audits are necessary. And they need to be repeated often because as we change and further develop our websites, we often end up adding new content or code which might not play together well in terms of performance.
In this article we’ll look at what to measure in a website performance audit, how to run a website performance audit and how to understand some of the issues raised by the automated tools available on the market. We focus on WordPress as it is widely used, powering more than 43% of the web – but even If your site doesn’t use WordPress, you can still benefit from understanding how to run an audit on your website.
How to run a website performance audit on WordPress
Choose a page url that you would like to test. For example your homepage and then visit one of the tools listed below, paste your url and begin the test. You may need to wait a few minutes for the test to complete. So you can get this started and then come back here to start reviewing some of the most common problems and how to fix them.
When it comes to website optimization and maintenance, conducting a website audit is paramount for identifying areas that need improvement to enhance user experience and search engine rankings. Utilizing website audit tools like Google PageSpeed Insights, GTmetrix, and WebPageTest can provide valuable insights into a site’s performance, loading times, and opportunities for enhancement. Below, we’ll discuss how each of these tools works and explore the difference between simulated lab tests and real-time field tests.
Google PageSpeed Insights
Perfect for beginners.
Google PageSpeed Insights is a service provided by Google that analyzes the content of a web page, then generates suggestions to make that page faster. It functions by gathering data from both lab and field performance. The lab data is collected in a controlled environment and is useful for debugging performance issues, as it provides a consistent, reproducible environment. Lab data is critical for testing out changes and optimizations.
On the other hand, the field data (sometimes referred to as Real User Monitoring or RUM) reflects the real-world loading experience of actual users. This data is collected from users who have opted-in to syncing their browsing history, have not set up a Sync passphrase, and have usage statistic reporting enabled.
The tool analyzes several performance indicators, such as First Contentful Paint (FCP), which measures the time it takes for the first piece of content to appear on the screen, and Largest Contentful Paint (LCP), which focuses on the time it takes for the largest content element visible within the viewport to render.
GTmetrix
A great alternative.
GTmetrix goes beyond providing basic insights and offers a more comprehensive analysis. When you enter a URL, GTmetrix generates a performance report that grades your site and offers actionable recommendations. The tool uses Lighthouse (an open-source, automated tool for improving the quality of web pages) for some of its tests but adds further data and a user-friendly interface that many site owners appreciate. The default and free testing location is from Canada making this a good test for websites which target audiences from Northern America or Europe.
GTmetrix’s reports encompass various metrics such as PageSpeed score, YSlow score (a Yahoo provided metric similar to Google’s PageSpeed score), fully loaded time, total page size, and the number of requests made to load the page fully.
WebPageTest
Packed with data for professionals.
WebPageTest is a more advanced tool that provides a wealth of information through its testing options, including the ability to select from various testing locations around the world, which helps in understanding how site performance varies globally. This is particularly useful for websites with an international audience.
WebPageTest runs a series of tests, similar to GTmetrix, to measure the website’s performance under different conditions. It offers a variety of test configurations such as browser type, device, connection speed, and more, giving developers granular control over their testing environment. This gives the tool a lab-like testing precision, but it also allows testers to approximate real-world conditions more closely by selecting parameters that their users are likely to experience.
Test your PageSpeed Score now with Google’s PageSpeed API (Desktop Test)
Results may take 5-10 seconds to load. Your score out of 100 will display below. And the key issues identified. We recommend running a full test when you get time via Pagespeed Insights.
Simulated Lab Tests vs. Real-Time Tests
Both simulated lab tests and real-time tests serve distinct purposes during website optimization.
- Simulated Lab Tests: These tests are performed in a controlled environment with predefined parameters, such as network speed, device type, and browser. Tools like WebPageTest and GTmetrix make extensive use of this type of testing as it allows developers to consistently reproduce testing scenarios for debugging and optimizing. The results are immediate and unaffected by the variability of real-world conditions, which makes identifying bottlenecks and other issues easier.
- Real-Time Tests: Real-time tests, as the name implies, measure the performance of a website as experienced by actual users under real-world conditions. These tests can be affected by many external factors such as the user’s device performance, network conditions, and even the time of day. Google PageSpeed Insights incorporates real-time tests by using field data to provide insight into how users experience a website.
While lab tests are excellent for identifying technical problems and testing fixes in a consistent environment, real-time tests are invaluable for understanding actual user experience – the web performance metrics that you are willing to accept should also be determined by your target audience. If you’re website is targeted to people that may be visiting from a weak or poor internet connection then speed should be a major priority, on the other hand if your core audience is an urban group in regions with good internet connectivity and reliable speeds then you may end up accepting poorer website performance scores. A comprehensive website audit strategy should involve both types of testing, lab simulated and also from the perspective of end users, to ensure that a website is not only theoretically optimised but also delivers fast and reliable performance in the hands of its real-world users.
🌊 You won’t get lost in the data from your website. We’ll explain what your data means and how to use it to get more visitors and sales. Get a quote →
Understanding the audit
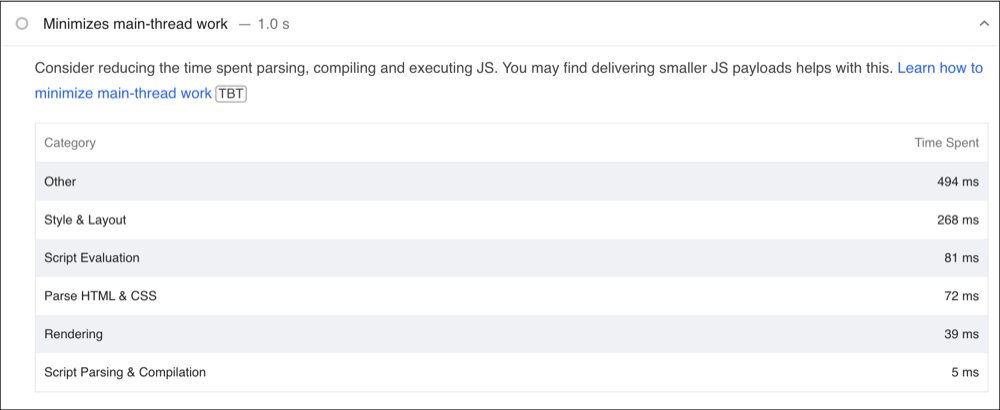
Problem name: Minimise Main-Thread Work
Problem description:
The main thread is where most of a browser’s work happens, including parsing HTML, executing JavaScript, and painting pixels on the screen. “Minimise Main-Thread Work” means that your website is making the browser do too much work at once, which can slow down the time it takes for the page to become interactive. Browsers have limits to how much “thread-work” they can handle and the power, by which we mean processing speed and available memory, of the user’s device may determine how well your website works.
How to fix:
To reduce main-thread work in WordPress:
- Minimise JavaScript: Use a plugin to minify and combine JavaScript files, reducing their size and the number of requests needed.
- Reduce Third-Party Scripts: Limit the use of external scripts such as ads scripts and analytics pixels. Consider reworking how these scripts are loaded so that they only load after all the main content on the page is ready and interactive.
- Profile and Reduce Long Tasks: Use browser developer tools to identify and shorten long tasks that block the main thread.
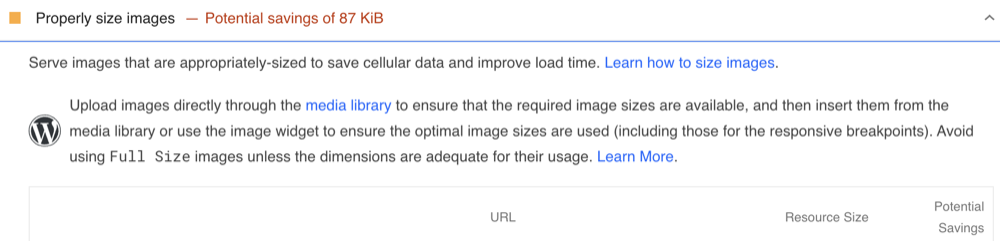
Problem name: Properly Size Images
Problem description:
This means the images on your site are larger than they need to be for the dimensions in which they’re displayed. Beyond sizing, choosing the right format matters—learn about WebP vs JPG vs PNG and when to use each. Oversized images use more data and load slower than necessary, negatively affecting page load times and user experience.
How to fix:
Correctly size images on your WordPress site. Edit them before uploading and for the images that are already uploaded try running a clean-up in bulk.
- Resize Images: Before uploading, use image editing tools to resize images to the maximum display size they will have on your website.
- Use Responsive Images: Ensure your theme utilizes the srcset attribute so different sized images are served based on the user’s device.
- Automate Optimisation: Employ plugins that automatically resize and compress images upon upload, like Smush or Imagify.
- Audit and Replace Old Images: Go through existing images and replace any that are not properly sized with optimized versions. You can also do this in bulk with plugins – but it may take a while depending on the power of your web server and the number of unoptimised images you have.
Problem name: Reduce Unused JavaScript
Problem description:
This problem occurs when your website loads JavaScript files that include code that never actually gets used. This unnecessary code can slow down page loading times since the browser has to download, parse, and compile code that doesn’t contribute to the page.
How to fix:
To reduce unused JavaScript on a WordPress site:
- Audit Scripts: Use tools like Google Chrome’s Coverage tool to detect unused JavaScript.
- Remove or Replace Plugins: Some plugins might be adding JavaScript that isn’t needed; consider removing them or finding alternatives that are more lightweight.
- Defer Loading of Scripts: Use a plugin or custom code to defer the loading of JavaScript files until after the main content has been loaded.
- Optimise and Refactor: If you have custom JavaScript, refactor it to remove unnecessary code and optimize what’s left.
Problem name: Enable Text Compression
Problem description:
Text compression refers to making your website’s text-based files (like HTML, CSS, and JavaScript) smaller, so they load faster for visitors. Not enabling text compression means you’re missing out on an easy opportunity to improve your site’s performance.
How to fix:
To enable text compression on a WordPress site:
- Utilise a Caching Plugin: Many caching plugins include options to enable GZIP or Brotli compression for your website.
- Modify .htaccess: For Apache servers, you can edit the .htaccess file to enable compression (you should be comfortable with server configurations or work with a developer for this).
- Check With Your Hosting Provider: Some hosts enable compression by default, or can turn it on for you if you ask.
Problem name: Eliminate Render-Blocking Resources
Problem description:
In layman’s terms, this means that there are certain files (like stylesheets and JavaScript) that are preventing the web page from being displayed before they are fully loaded. This causes a delay in the time it takes for the content to appear on the screen, making the site feel slower.
How to fix:
To tackle this issue on a WordPress site, you can:
- Install a Caching Plugin: Use plugins like W3 Total Cache or WP Rocket, which have options to minify and combine CSS and JavaScript files, as well as defer non-essential scripts.
- Defer JavaScript: Manually or via plugin, defer the loading of JavaScript files until after the main content has rendered.
- Optimize CSS Delivery: Identify and inline critical “above-the-fold” CSS, while asynchronously loading the rest of the style files.
- Use a CDN: A Content Delivery Network can help by serving files from servers closer to the user’s location, potentially reducing loading times.
- Remove Unused CSS/JS: Use tools to identify and remove styles and scripts that are not being used.
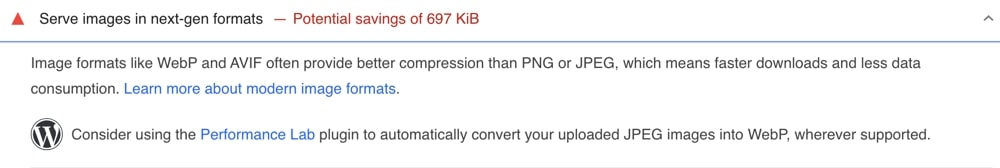
Problem name: Serve Images in Next-Gen Formats
Problem description:
This refers to serving images on your site in newer, more efficient formats like WebP, AVIF, or JPEG 2000 instead of traditional formats like JPEG or PNG. These newer formats offer better compression and quality, which means faster loading times and less data consumption.
How to fix:
On a WordPress site:
- Use an image optimisation plugin: Plugins like ShortPixel or EWWW Image Optimizer can automatically convert uploaded images to next-gen formats.
- Enable WebP through your hosting service: Some web hosts offer built-in solutions for serving next-gen image formats.
- Use a CDN that Supports WebP: Some CDN services can automatically convert images to WebP when they’re requested by a browser that supports the format.
Problem name: Reduce Initial Server Response Time
Problem description:
This means that the server hosting your WordPress site is taking too long to start sending data to the browser. A slow server response can delay everything else, from loading scripts to rendering the page fully.
How to fix:
To improve server response time:
- Optimise Web Hosting: Ensure your hosting plan is adequate for your traffic and website demands. Upgrading to a faster host or plan can significantly improve response time.
- Use a Caching Plugin: This will store a version of your site’s pages and serve them quickly to visitors, reducing the load on the server.
- Optimise Database: Use a plugin like WP-Optimize to clean up your WordPress database by removing unnecessary data.
- Disable Unnecessary Plugins: Deactivate and delete any plugins you don’t use, as too many plugins can slow down server response time.
- Keep WordPress Core, Themes, and Plugins Updated: Ensuring everything is up to date can improve performance and security, which may help reduce server response times.
Problem name: Avoid an Excessive DOM Size
Problem description:
DOM stands for Document Object Model, and it’s essentially the structure of your webpage. An “excessive DOM size” means that the webpage has too many elements (like images, text, buttons, etc.). This can slow down the page’s load time because the browser has more work to do to render the page.
How to fix:
To address an excessive DOM size in WordPress:
- Simplify Your Design: Use a more minimalist theme that requires fewer blocks, widgets, and elements.
- Limit Use of Plugins: Each plugin may add additional code and DOM elements to your site. Only use plugins that are absolutely necessary.
- Optimise Content: Structure your content with proper hierarchy and avoid unnecessary nesting of HTML elements.
- Custom Code Clean Up: If you have custom HTML, CSS, or JavaScript, review it for efficiency and remove any redundant or unnecessary code that adds to the DOM size.
- Use a Page Builder Wisely: If using a page builder, use its optimisation settings to reduce output code and avoid adding too many complex elements.
What metrics are used to measure web performance?
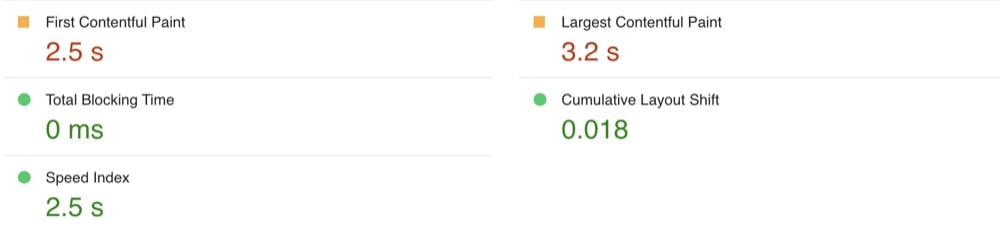
Google does not simply assess your page speed based on observation. Their team has established a set of APIs and metrics to accurately measure a web page’s performance. During a website performance audit, you will come across these metrics:
- First Contentful Paint (FCP): Measures how long it takes for any part of the web page to appear on the screen after you start loading it.
- Largest Contentful Paint (LCP): Measures how long it takes for the largest content element visible in the viewport (such as a hero image or heading) to fully render. This is a Core Web Vital.
- Interaction to Next Paint (INP): Measures responsiveness – how long it takes for the page to respond after you interact with it, like clicking, tapping, or typing. This replaced First Input Delay (FID) as a Core Web Vital in March 2024.
- Total Blocking Time (TBT): Measures the total time the main thread was blocked by long tasks (over 50ms) between First Contentful Paint and Time to Interactive. A high TBT indicates the page may feel sluggish.
- Cumulative Layout Shift (CLS): Measures the total amount of unexpected movement of page elements as the page loads. Elements shifting around frustrates users and can cause accidental clicks. This is a Core Web Vital.
- Time to First Byte (TTFB): Measures how long it takes for the network to start sending data after you request a webpage.
Each of the metrics plays off each other, for example your first contentful paint leads to your last contentful paint. But some metrics are ultimately more important than others. There metrics are called the “Core Web Vitals”, a name coined by Google which represents the metrics associated with a healthy and performant website (at least in their eyes). Core Web Vitals include the metrics Cumulative Layout Shift (CLS), Interaction to Next Paint (INP), and Largest Contentful Paint (LCP).
Conclusion
In conclusion, knowing how to do a website performance audit using WordPress is essential for keeping your site running smoothly and maintaining a great user experience. By understanding the key metrics and using suggested tools in the article, you can pinpoint any performance bottlenecks and apply the right fixes. Regularly running these audits will help ensure your site remains fast and responsive as it grows and changes. So, whether you’re a developer or a business owner, making web performance audits a part of your routine will pay off in terms of both user satisfaction and search engine rankings.